Introduction
Salivary and urinary methods for ovulation detection have been associated with reproductive health for many years [1–5]. However, the gold standards for detecting ovulation and menstrual cycle hormones are transvaginal ultrasound and serum hormone testing of estradiol, progesterone, and luteinizing hormone, respectively [6–8]. These gold standards are used in clinical and research settings [6,9] but would not be practical in field settings. Therefore, with the renewed attention towards the menstrual cycle and female participants in research studies, uptake in the use of salivary and urinary hormone testing to detect menstrual cycle hormones has occurred due to their feasibility [6,10,11].
It is common to see the menstrual cycle referred to as 28 days in length, divided by ovulation into two phases – the follicular and luteal phases [12–14]. Current literature suggests that several mechanisms can contribute to menstrual cycle variability and that 28 days is not a complete representation of typical menstrual cycles [10,13]. This variability and the impact of hormones in the phases [12,15] has resulted in further delineation to include early, mid, and late follicular, and mid and late luteal phases [10].
Several authors suggest that standardized methods are needed for measuring hormones during the menstrual cycle, and they must be valid and precise because of the known variabilities [10,13,16,17]. The feasibility and viability of salivary and urinary testing to detect menstrual cycle hormones, and subsequently, identify menstrual phases, is promising [8,9]. However, the evidence supporting salivary and urinary assay quality parameters of validity (i.e., sensitivity, specificity) and precision (i.e., intra- and inter-assay coefficient of variation; CV) are unclear [17,18]. This may be in part due to the differing measurement approaches, with saliva reflecting the bioavailable fraction of the hormone (i.e., unbound) and urinalysis reflecting the hormone metabolites [6,18]. Therefore the objective of this scoping review was to assess the validity and precision of salivary estradiol and progesterone, and urinary luteinizing hormone assays for menstrual cycle hormone detection in healthy, naturally cycling, premenopausal women. The goal was to determine if the salivary and urinary menstrual cycle hormone detection methods could identify menstrual cycle phases.
Methods
The protocol and the scoping review were conducted in accordance with the Joanna Briggs Institute (JBI) methodology for scoping reviews described in the JBI Manual for Evidence Synthesis (2020). The PRISMA extension for scoping reviews checklist (PRISMA-ScR) was used to report all aspects of review methods (Supplementary A) [19]. The preliminary protocol was established a priori and registered May 5, 2022, with the University of Calgary PRISM Kinesiology Research & Publications Collections. After the search was conducted with the preliminary protocol, it was determined to be too broad to answer the objectives, and therefore it was narrowed in scope. The final protocol was updated on June 28, 2022 (http://hdl.handle.net/1880/114625.2).
Eligibility
The review aimed to examine salivary and urinary methodology for menstrual cycle hormone detection in premenopausal women. There were no restrictions on country or language. Inclusion and exclusion criteria, rationale, and restricted date ranges can be found in the final protocol [20].
Information sources and search strategy
Prior to the search, key articles were identified in PubMed and Ovid MEDLINE(R). The articles were reviewed for keywords and subject headings to inform the preliminary search. One article was removed from the final protocol as it did not meet the final inclusion criteria. Search concepts included menstrual cycle, ovulation, salivary methods, urinary methods, and hormones (i.e., luteinizing hormone, estradiol, and progesterone). The protocol search was tested in Ovid MEDLINE(R) and Epub Ahead of Print, In-Process, In-Data-Review & Other Non-Indexed Citations and Daily, with a date limit of 1999 to June 16, 2022 (date search was conducted), to capture the influx of recent literature.
The databases searched included: MEDLINE(R) and Epub Ahead of Print, In-Process, In-Data-Review & Other Non-Indexed Citations and Daily (Ovid); Embase (Ovid); CINAHL Plus with Full Text (EBSCO); Cochrane Central Register of Controlled Trials (CENTRAL; Wiley); Scopus (Elsevier); and ProQuest Dissertations and Theses Global (ProQuest). The search was supported by a librarian (KAH) and uploaded into Covidence on June 17, 2022. The full search strategy can be found in Supplementary B.
Study selection
All studies were collected and uploaded into Covidence (www.covidence.org), which automatically removed duplicates. Pilot screening was completed on 25 articles by two reviewers (MLD, AK) using the eligibility criteria from the final protocol, achieving 80% agreement. Conflicts were discussed and resolved, and a third reviewer (PKDB) was consulted when consensus could not be reached, resulting in 100% agreement. Titles and abstracts were then screened individually by the same reviewers (MLD, AK) according to the inclusion and exclusion criteria.
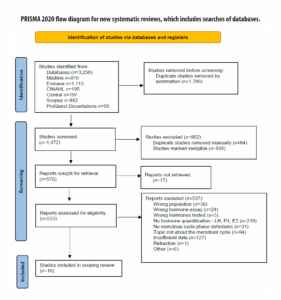
The next stage involved uploading and screening full texts. A total of 225 full-text articles were manually retrieved and uploaded into Covidence for screening. Seventeen studies could not be retrieved (Figure 1). During this process, one article was identified as retracted through the reference management software (Zotero 6.0.18) and was subsequently excluded. Conference abstracts and posters were also excluded under the category of “insufficient data” due to the absence of reported hormone levels.
The JBI guidelines state that scoping reviews may be iterative throughout the review process [21]. Accordingly, additional inclusion criteria were established during full-text screening to narrow the scope of the review, as outlined in Supplementary C. Following the JBI approach for scoping reviews, a critical appraisal of study quality was not conducted [22].
Data charting: extraction & presentation
Data extraction was conducted independently by a single reviewer (MLD). A charting table was piloted on two articles, and revisions were made to ensure all relevant data were captured (Supplementary D). Upon completion, the full extraction table was divided into two separate tables focusing on salivary and urinary assay quality parameters. Original hormone values were isolated and converted to pg/mL and mIU/mL for comparability, with both units reported (Table 2). Results were summarized descriptively and presented in tabular format, including frequencies and means.
Results
Study inclusion
A total of 16 studies were included—15 published between the early 2000s and 2013, and one published in 2021. The older age of most articles prompted an adjustment in terminology for the study population, shifting from “eumenorrheic” females, as used by Elliott-Sale et al. [13], to “naturally” or “regularly menstruating.” Figure 1 outlines the literature search, screening, and study selection process.
Characteristics of included studies
All included studies were published in English between 2000 and 2021. The studies originated from 14 countries, with the United States (n=5) being the most frequently represented [12,24–27]. Two studies did not specify the location of participant data [4,28]. Sample sizes ranged from 11 to 198 participants, and approximately 30% (5/16) of the studies reported the number of menstrual cycles analyzed [12,24,29–31].
Table 1 summarizes study characteristics and menstrual cycle phase definitions. The studies were categorized into salivary and urinary hormone testing groups, with eight studies in each category.
| Author Year |
Country | Sample Size | Age (yrs.) | Cycle No. |
Matrix Method | Phase Definition |
Menstrual cycle Characteristics (days) |
|---|---|---|---|---|---|---|---|
| Ecochard (2000) [29] |
Belgium France Germany Italy Spain |
80 | 32.3 (19.0 - 42.0) |
199 | Urine | Early FP: day 3 ±1 day. Peri-ovulatory: US day of OV ±1 day. LP: US day of OV +5, +7, +9 days. |
IPSI. OV CL: 28.2 Menses: 5.0 FPL: 14.6 LPL: 21.7 CONTRA. OV CL: 28.2 Menses: 5.4 FPL: 14.6 LPL: 21.8 |
| Ghazeeri (2000) [25] |
USA | 11 | - | - | Urine | OV: LH peak. | Day of LH surge: 14 or 15 (11 – 17) |
| Gann (2001) [27] |
No report | 12 | 35.0 (26.0 – 39.0) |
- | Saliva | Midcycle day 0: LH detected, 14 days prior to onset of subsequent menses, or 3 day running mean of 20% increase of P4 levels over previous daily average. Midluteal center: midpoint between day 0, and end of cycle. P4 peak: middle day of the highest running mean of P4. |
- |
| Ishikawa (2002) [4] |
No report | 58 | 24.8 ±5.1 (19.0 - 36.0) |
- | Saliva | LP: normalized to day 0 (LH surge). Early LP: day 1 - 4. Mid LP: day 5 - 9. Late LP: day 10 - 12. |
- |
| Korot’ko (2002) [34] |
Russia | 17 | (28.0 – 30.0) | - | Saliva | Proliferative: day 5 & 6 of cycle. Secretory: day 21 & 22 of cycle. |
CL: (28.0 – 30.0) |
| Vitzthum (2002) [33] |
Bolivia | 55 | *POORER 28.9 ±3.7 BETTER-OFF 28.1 ±4.1 |
- | Saliva | FP: day 3 of the cycle (first day of cycle +2) to day 15 (around ovulation, prior to P4 rise). OV: mean peak P4 > 110pmol/L. LP: final 14 days of the cycle. |
- |
| Chatterton (2005) [24] |
USA | 21 | 41.1 (34.0 – 48.0) |
- | Saliva | FP: numbered negatively (day zero included). LP: numbered positively from the day of OV (day 0). |
- |
| Barrett (2006) [31] |
Norway | 192 | 30.8 ±3.1 (24.9 - 35.9) |
- | Saliva | FPL: days from menstrual onset to the mid-cycle estradiol drop. LPL: days from the day after the mid-cycle estradiol drop to onset of subsequent menses. |
CL: 28.3 ±3.4 (21.0 - 47.0) FPL: 15.0 ±3.8 (7.0 - 36.0) LPL: 13.4 ±1.7 (11.0 - 17.0) |
| Williams (2006) [30] |
India | 198 | 28.8 ±3.8 (24.0 – 36.0) |
1067 | Urine | FP: low, steady levels of LH and FSH. OV: signaled by dramatic and rapid increase of LH and FSH. |
CL: 30.0 ±4.4 |
| Cole (2009) [12] |
USA | 167 | (18.0 – 36.0) | 458 | Urine | LH peak: day with highest LH. FP: start of menses to LH peak. LP: ovulatory window (LH peak) to first day of next menses. |
CL: 27.7 ±2.4 (20.0 – 34.0) FPL/Day of LH peak: 14.7 ± 2.4 (9.0 – 20.0) LPL: 13.2 ±2.0 (9.0 – 20.0) |
| Blackwell (2012) [28] |
Australia Chile New Zealand |
62 | 34.0 ±6.0 | 113 | Urine | FPL: first day of bleeding to the day of the LH peak inclusive. LH peak: day with the highest LH value close to the E1G peak day and on, or before, the first significant increase in PdG excretion rate. LPL: days following the LH peak to the day before the start of menses. |
CL: 28.1 ±3.1 FPL: 14.8 ±3.1 LPL: 13.3 ±1.5 |
| Barrett (2013) [32] |
Norway | 192 | 30.7 ±3.1 | - | Saliva | FPL: days from menstrual onset to the mid-cycle estradiol drop. LPL: days from the day after the mid-cycle estradiol drop to onset of subsequent menses. |
CL: 28.4 ±2.4 FPL: 15.0 ±3.8 LPL: 13.4 ±1.7 |
| Ecochard (2013) [35] |
Belgium France Germany Italy Spain |
107 | 32.4 (19.0 – 44.0) |
283 | Urine | Fertile phase: estimated during the pre-ovulatory phase as the first day of menses to the end of the US day of OV. Infertile phase: day after OV, up to the following menses. |
CL: 28.0 (22.0 – 44.0) FPL: 14.8 (9.0 – 33.0) LPL: 13.4 (7.0 – 17.0) |
| Rowe (2013) [26] |
USA | 39 | 26.8 ±5.6 | - | Saliva | FPL: subtract date of menses start from ovulation date. LPL: subtract date of ovulation from date of menses start in next cycle. |
PROGINS CARRIER Menses: 5.6 ±1.2 CL: 28.3 ±3.5 FPL: 13.5 ±1.9 LPL: 14.1 ±2.5 NON-CARRIERS Menses: 5.0 ±0.8 CL: 29.6 ±3.0 FPL: 13.4 ±1.6 LPL: 16.2 ±2.7 |
| Johnson (2015) [9] |
Germany | 40 | 28.9 ±4.8 (18.0 – 37.0) |
- | Urine | Ovulation: day 0. LH Surge: first rise from baseline LH levels. |
CL: 27.7 ±3.4 OV: 15.4 ±3.8 LPL: 12.3 ±2.5 |
| Bouchard (2021) [23] |
Canada USA | 21 | 33.4±5.5 (23.0 – 42.0) |
62 | Urine | OV (day 0): day after highest LH value in the cycle followed by a decrease by 50% on the following 1–2 days. | CL: 29.1 ±3.7 (23.0 – 41.0) FPL: 17.0 ±3.8 (11.0 –28.0) LPL: 12.1 ±2.3 (8.0 – 20.0) |
SD, Standard deviation; CL, Cycle length; Menses, Menstruation; FPL, Follicular phase length; FP, Follicular Phase; LPL, Luteal phase length; LP, Luteal Phase; OV, Ovulation; US, Ultrasound; E1G, Urine estradiol metabolite; PdG, Urine progesterone metabolite; IPSI, OV Ipsilateral ovulation; CONTRA, OV contralateral ovulation; PROGIN CARRIER, progesterone receptor gene carrier; *POORER and BETTER OFF terms were used in Vitzthum 2002 study to categorize socio-economic status.
Menstrual cycle phase definitions
Several approaches were used to divide the menstrual cycle in the included studies. A two-phase approach (follicular and luteal) was used by four studies [25,27,32,33]. Ovulation or luteinizing hormone peak was used as the midpoint of the cycle, in addition to the follicular and luteal phases, in five studies [12,29–31,34]. A single phase was addressed by five studies—three examined ovulation or luteinizing hormone peak [9,24,26], and the other two examined the luteal phase [4,28].
The terminology used to describe follicular and luteal phases included “proliferative” and “secretory” [35], and “fertile” versus “infertile” phases [36]. ‘Menstruation’ or ‘menses’ (i.e., bleeding phase) was not defined as part of the menstrual cycle in any study. However, one study defined the early follicular phase as cycle day three, alluding to menstruation [30].
Ultrasound was used to determine ovulation and divide the menstrual cycle into follicular and luteal phases in two studies [30,36]. Phases were identified based on counting past ovulation as day zero in three studies [25,27,35]. At least one hormone was used to identify cycle phases in 11 studies [4,9,12,24,26,28,29,31–34].
Validity and reliability of urine and saliva methods
Various assay methods were used with different quality parameters. Table 2 summarizes the validity and precision markers reported for each study. While validity is a broader construct involving multiple parameters, for the purpose of this review, validity was defined by measures of sensitivity and/or specificity and precision [18]. Either a sensitivity or specificity value for urine assays was identified in three studies. Sensitivity values were reported by Cole et al. [12] as 0.20 mIU/mL and Johnson et al. [9] as 0.10 mIU/mL. Specificity was reported by Ghazeeri et al. [25] as 1.50%. Specificity refers to the assay’s false positive rate, indicating a 1.5% chance, or very low occurrence, that the assay reacts with a substance in the sample that is not the target hormone [18]. Intra- and inter-assay CVs were reported in three studies for urine assays [9,12,26], while Ecochard et al. [35] reported intra-assay CV only.
Sensitivity was reported for three salivary studies as 4.0 pmol/L for estradiol and 13.0 pmol/L for progesterone [32,33], and 3.2 pmol/L for progesterone [4]. No studies reported on salivary specificity. Both intra- and inter-assay CVs were reported in five studies [4,25,28,32,33]. Most of the intra-assay CVs for both estradiol and progesterone were < 10% [4,25,32,33]. For progesterone, one inter-assay CV met this criterion at an analyte concentration of 194 pmol/L [4].
In total, seven studies mentioned the comparability of the given assay method to serum (Supplementary E). Salivary and urinary luteinizing hormone assays were reported as comparable to serum in four studies [4,25,28,35] and three studies [9,24,26], respectively. The remaining studies did not discuss method comparability.
| Urinary Luteinizing Hormone Assay | |||||
|---|---|---|---|---|---|
| Study | Brand | Sensitivity (mIU/mL) | Specificity (%) | Intra-Assay CV (%) | Inter-Assay CV (%) |
| Ecochard (2000) [29] | Delfia - Time-resolved fluorometric immunosorbent assays | - | - | - | - |
| Ghazeeri (2000) [25] | Diagnostic Products Inc. – radio-immunoassay LHdouble anti-body kit. (Los Angeles, CA, USA). | - | 1.50 | 4.50** | 6.80** |
| Williams (2006) [30] | Immunoenzymatic assay using commercial kit (Radim,Italy). | - | - | - | - |
| Cole (2009) [12] |
Diagnostic Products Corporation - immulite automated test (Siemens,Los Angeles, CA, USA) | 0.20 | - | < 5.00* | < 5.00* |
| Blackwell (2012) [28] | Ovarian Monitor-pre-coated assay tubes (St. Michael’s ResearchFoundation, Melbourne, AU) | - | - | - | - |
| Ecochard (2013) [35] | Delfia - Time-resolved fluorometric immunosorbent assays | - | - | 8.66 | - |
| Johnson (2015) [9] | SPD Development Co., Ltd - In-house assay of immobilizedbiotinylated antibody (antibody #2119; Bedford, UK) | 0.10 | - | < 5.00 | < 5.00 |
| Bouchard (2021) [23] | Mira Monitor (Quanovate Tech Inc.) | - | - | - | - |
| Salivary Estradiol & Progesterone Assays: E2, P4 | |||||
|---|---|---|---|---|---|
| Study | Brand | Sensitivity (pmol/L) | Specificity (%) | Intra-Assay CV (%) | Inter-Assay CV (%) |
| Gann (2001) [27] |
E2: Diagnostic ServicesLaboratories – antiserum & I-labeled E2 tracer (Webster, TX, USA) | - | - | 9.9 | 11.6 |
| P4: direct radioimmunoassay, with H-progesterone as the tracer |
- | - | 13.5 | 18.0 | |
| Ishikawa (2002) [4] | P4: BioResearch – solid-phaseenzyme immunoassay (Ireland) | 3.2 | - | 2.4 3.3 4.1**** |
11.5 12.8 8.9**** |
| Korot’ko (2002) [34] | E2 & P4: Kodak Clinical Diagnostics, Ltd. (Amersham,USA, & Amerkard, Russia); Immunodiagnostic system (Amerlyte, UK) | - | - | - | - |
| Vitzthum (2002) [33] | P4: Direct radioimmunoassay, H-progesterone as the tracer (Lu et al., 1997) |
- | - | - | - |
| Chatterton (2005) [24] | E2: Diagnostic Services Laboratories – double-antibodyradioimmunoassay, (Webster, TX, USA) | - | - | 9.9 | 20.2 |
| P4: as above | 7.9 | 19.9 | |||
| Barrett (2006) [31] |
E2: Diagnostic Systems Laboratory – N 1-125 double-antibodyradioimmunoassay kit (#39100, Webster, TX, USA) | 4.0, | - | 9.0 | 23.0 - 13.0*** |
| P4: as above | 13.0 | 10.0 | 19.0 - 12.0*** | ||
| Barrett (2013) [32] |
E2: Diagnostics Systems Laboratory– I-based radioimmunoassay kits (Webster, TX, USA) | 4.0, | - | 9.0 | 23.0 - 13.0*** |
| P4: as above | 13.0 | 10.0 | 19.0 - 12.0*** | ||
| Rowe (2013) [26] |
P4: DRG International – Salivary progesterone enzyme immunoassaykits | - | - | - | - |
E2 estradiol; P4 progesterone
" – " not reported for either hormone.
* study reported CV but did not indicate whether inter- or intra- assay (pg. 523)
** intra-assay CV for range of 5.1 – 172.0 mIU/mL, inter-assay CV for range of 13.0 – 190.0 mIU/mL
*** ranges reported are for low and high concentrations respectively for both E2 & P4
**** intra-assay CV for 170, 386, and 734 pmol/L P4 respectively; inter-assay CV for 183, 381, 194 pmol/L P4 respectively
Luteinizing hormone, estrogen, and progesterone
Hormone values reported in each study are summarized in Table 3. The calculated values and ranges represent the reported values converted into mIU/mL for urine and pg/mL for saliva where applicable. Luteinizing hormone peak was reported in five studies [9,12,26,29,31]. Bouchard et al. [23] reported values on and surrounding the luteinizing hormone peak, while two studies reported luteinizing hormone throughout the entire menstrual cycle [30,36].
Estradiol was reported in four studies [25,32,33,35]. One study examined estradiol levels during the follicular phase [33], and another reported levels in the follicular, ovulatory, and mid-luteal phases [32]. The remaining studies examined both the follicular and luteal phases [25,35].
All studies that measured salivary hormones reported progesterone (Table 3). Progesterone levels were studied across the menstrual cycle in two studies [34,35]. The remaining studies measured progesterone at least once during the luteal phase [4,25,27,28,32,33].
| Urinary LHHormone Values | ||||
|---|---|---|---|---|
| Study | Menstrual cycle Phase | Reported Mean ± SD (mIU/mL)* | Reported Range (mIU/mL)* | |
| Ecochard (2000) [29]*** |
Early Follicular Phase Peri-Ovulatory Luteal Phase |
3.74, 3.56 16.16, 15.67 5.69, 5.84 |
- - - |
|
| Ghazeeri (2000) [25] |
LH Peak Day | - | 13.5 – 73.0 | |
| Williams (2006) [30]**** |
Mid-Cycle (3 days prior) LH Peak |
4.0 24.4 |
0.1 – 22.0 1.1 – 74.3 |
|
| Cole (2009) [12] |
LH Peak | - | 87.0 – 188.0 ** | |
| Blackwell (2012) [28] |
LH Peak (Day 0) | 39.5 ± 39.5 | - | |
| Ecochard (2013) [35] |
Early Follicular Phase (Days 2 - 4) Peri-Ovulatory (US-DO ± 1 day) Luteal Phase (US-DO +5, 7, & 9 days) |
- - - |
0.08 – 11.77 0.54 – 51.82 2.39 – 213.52 |
|
| Johnson (2015) [9] |
Intact LH Peak Day (Day -1) | 44.6 | - | |
| Bouchard (2021) [23] |
Day -2 LH Peak Day (Day -1) Day of Ovulation (Day 0) |
5.4 ± 4.3 24.0 ± 18.5 7.1 ± 7.1 |
1.0 – 15.4 9.3 – 54.6 1.0 – 33.1 |
|
| Salivary E2 Hormone Values | ||||
| Study | Menstrual cycle Phase | Reported Mean ± SD (Range) in pmol/L* | Calculated Mean ± SD (pg/mL) | Calculated Range (pg/mL) |
| Korot’ko (2002) [34] |
Proliferative Secretory |
705.2 ± 69.6 812.2 ± 111. | 192.1 ± 19.0 221.2 ± 30.4 |
- |
| Chatterton (2005) [24] |
Follicular Phase Luteal Phase |
22.1 20.6 |
6.0 5.6 |
- |
| Barrett (2006) [31] |
Follicular (Day -10 to -1) Mid-Follicular (Day -10 to -6) Late Follicular (Day -5 to -1) Peak Mid-Luteal (Day +5 to +9) |
18.2 ± 9.7 (5.0 – 72.0) 13.9 ± 8.9 (4.0 – 66.0) 21.2 ± 10.8 (4.4 – 61.6) 35.7 ± 18.4 (6.0 – 104) 19.7 ± 11.0(4.0 – 72.4) |
5.0 ± 2.6 3.8 ± 2.4 5.8 ± 2.9 9.7 ± 5.0 5.4 ± 3.0 |
1.4 – 19.6 1.1 – 18.0 1.2 – 16.8 1.6 – 28.3 1.1 – 19.7 |
| Barrett (2013) [32] |
Follicular (Day -10 to -1) | 18.0 ± 9.6 | 4.9 ± 2.6 | - |
| Salivary P4 Hormone Values | ||||
| Study | Menstrual cycle Phase | Reported Mean ± SD (Range) in pmol/L* | Calculated Mean ± SD (pg/mL) | Calculated Range (pg/mL) |
| Gann (2001) [27]**** |
Peak | 120.2 | 37.8 | - |
| Ishikawa (2002) [4] |
Mid Luteal Phase (Day 5) Mid Luteal Phase (Day 9) Late Luteal Phase (Day 12) |
318.0 ± 170.0 287.0 ± 169.0 120.0 ± 136.0 |
100.0 ± 53.5 90.2 ± 53.1 37.7 ± 42.8 |
- - - |
| Korot’ko (2002) [34]**** |
Proliferative Secretory |
0.2 ± 0.06 0.4 ± 0.09 |
0.1 ± 0.02 0.1 ± 0.03 |
- - |
| Vitzthum (2002) [33]*** |
Follicular Phase (Day 3 to -15.5) Peak Luteal Phase (final 14 days of menstrual cycle) |
65.0, 76.0 208.0, 232.0 142.0, 167.0 |
20.4, 23.9 65.4, 73.0 44.7, 52.5 |
- - - |
| Chatterton (2005) [24] |
Luteal Phase | 436.0 | 137.1 | - |
| Barrett (2006) [31] |
Luteal Phase (Day 0 to +9) Early Luteal Phase (Day 0 to +2) Early-Mid Luteal (Day +3 to +5) Mid Luteal (Day +5 to +9) Late Luteal (Day +10 to +14) |
143.6 ± 74.1 (17.8 – 532.4) 107.1 ± 60.7 (13 – 351.3) 146 ± 79.7 (12.3 – 444.3) 163.3 ± 87.4 (20.6 – 638.8) 114.7 ± 83.2 (13.9 – 563.8) |
45.2 ± 23.3 33.7 ± 19.1 45.9 ± 25.1 51.4 ± 27.5 36.1 ± 26.2 |
5.6 – 167.4 4.1 – 110.5 3.9 – 139.7 6.5 – 200.9 4.4 – 177.3 |
| Barrett (2013) [32] |
Luteal Phase (Day 0 to +14) | 143.4 ± 74.1 | 45.1 ± 23.3 | - |
| Rowe (2013) [26] |
Mid Luteal (Day 5 - 11 after OV) Mid Luteal Peak |
306.7 ± 125.7 433.3 ± 204.2 |
96.4 ± 39.5 136.3 ± 64.2 |
- - |
E2 estradiol; P4 progesterone; LH luteinizing hormone
* Not all studies reported mean ± SD (range). Values reported where applicable.
** single case example of LH between 8 consecutive cycles
Ecochard*** grouped hormones by ipsilateral and contralateral ovulation, respectively. Vitzhum*** grouped hormones by ‘poorer’ Bolivian women, and ‘better-off’ Bolivian women, respectively.
US-DO ultrasound day of ovulation, OV ovulation
All units are reported as mIU/mL or pmol/L with the exception of Williams**** in IU/L38, Gann**** in pg/mL (no conversion required), and Korot’ko**** in nmol/L (Conversions from nmol/L to pg/mL was completed by Endmemo online conversion calculators for P4 using 1 nmol/L = 169.204738 pg/mL).39
Conversions from pmol/L to pg/mL were completed by Endmemo online conversion calculators for E2 using 1 pmol/L = 0.272405 pg/mL.40
Conversions from pmol/L to pg/mL were completed by Units Lab online conversion calculators for P4 using 1 pmol/L = 0.3145 pg/mL.41
Discussion
In this scoping review, we found that the menstrual cycle was divided into different phases with various representative names, which may have been based on author discretion. For example, Gann et al. [27] stated that definitions or methods of determining phase lengths were arbitrary in nature. Likewise, the studies lacked definitions for “menstruation,” which may be due to menstruation not being a primary outcome of interest. The comparability, however between studies is reduced because of these inconsistencies in the number of phases reported, resulting in challenges when examining menstrual cycle literature [37]. Therefore, one limitation of the older literature is the lack of well-defined and consistent language in categorizing menstrual cycle phases.
Recommendations to standardize the number of phases have been suggested recently, with Elliott-Sale et al. [13] proposing a four-phase definition of the menstrual cycle based on hormone profiles. The four-phase hormone profile includes: when estradiol and progesterone are low during menstruation (Phase 1); prior to ovulation, when estradiol peaks (Phase 2); the luteinizing hormone surge (Phase 3); and after the ovulation surge, when progesterone peaks (Phase 4) [13]. Despite the time gap between when 93% (15/16) of the studies in this review were conducted and the definition of menstrual phases by Elliott-Sale et al. in 2021 [13], most studies reported menstrual cycle phases using at least one hormone. The hormone selected for measurement appeared to depend on assay type or research objectives.
Salivary estradiol and progesterone were primarily reported in the follicular and luteal phases, respectively, likely due to their peak levels during these phases [42,43]. Assay measurement tools, ethnicity, seasonality, testing dates, year of testing, and the possibility of conversion errors may explain the variability in hormone values and ranges reported [9,31,34]. An example of larger hormone concentration differences between studies is the higher estradiol values reported by Korot’ko and Gotovtseva [34] compared to estradiol values reported in other studies [25,32,33]. The reason, however for this difference remains unclear.
Luteinizing hormone levels were measured throughout the menstrual cycle in two studies [30,36], while the majority of studies primarily reported levels around ovulation. Means and ranges of luteinizing hormone values were variable between studies. Lower luteinizing hormone levels observed in some ranges and standard deviations reported could be due to anovulatory cycles or variability in luteinizing hormone amplitude and duration that was not captured by the study methodology [36]. Furthermore, hormone values reported in the older literature may not accurately represent present-day menstruating individuals due to common health, environmental, and behavioral factors that may impact the menstrual cycle [9,44,45].
To better understand the assay results, an in-depth review of the specific measurement tools are necessary, as multiple methods of analyzing hormone assays were used across studies (Table 2). Each of the methods shares core similarities, using a label to measure the binding affinity between an antibody and antigen. Key differences between the methods lie in the label types and, subsequently, the outcome measure. The methods used in each study were organized into three main assay categories: 1) radioimmunoassay, 2) enzyme immunoassay, and 3) fluorescent immunoassays. In general, a radioimmunoassay uses a radioactive isotope, such as iodine, to label the target analyte [46,47]. Enzyme immunoassays use an enzyme as a label, which catalyzes a reaction with the target analyte, resulting in a color change that indicates the analyte concentration [46,47]. Fluorescent immunoassays use a fluorescent molecule, and analyte concentration is measured by light wavelength [46,47]. Each method requires different analyses and instrumentation to measure hormones of interest, and differences between instrumentation may further contribute to the discrepancies observed in this review.
Future assay methods will expand, and instruments will likely become portable, allowing onsite analysis. For example, there is a push toward smaller, more compact Gas Chromatography-Mass Spectrometry (GC-MS) systems.
There was a lack of sensitivity and specificity values reported for luteinizing hormone assays [9,12,24,26,29–31,36]. Studies focused primarily on intra- and inter-assay CVs, with few reporting sensitivities [9,12]. All studies that reported CVs for urine assays were < 10%, suggesting good reliability [17,46].
Precision and validity measures were reported for salivary estradiol and progesterone, including sensitivity and intra- and inter-assay CVs. Most inter-assay CVs reported for estradiol and progesterone were > 10% [46], suggesting that the assay methods used had lower reliability when comparing between hormone assays [4,25,27,28,32,33]. However, intra-assay CVs were < 10%, demonstrating good measurement reliability within the same sample [4,25,32,33]. For studies reporting intra- or inter-assay CVs across varying analyte concentrations, mid- to higher-range analyte concentrations had greater precision (i.e., CV < 10%) [46]. Despite the limited reporting of quality parameters, seven studies stated that the urine or saliva methods used were comparable to serum [4,9,24–26,28,35].
Future literature developing salivary and urinary methods for menstrual cycle phase identification should consider an independent assessment of assay quality and report all assay quality parameters [18,46]. Assay quality measures can be obtained by contacting the original lab specialist or developer if assay methods from a different laboratory are used and cannot be assessed independently [18,46]. However, it is important to indicate in reporting that values from the developer may represent best-case scenarios and may not reflect the quality of assays in the study sample [18,46]. Despite this limitation, reporting assay quality parameters through independent testing or from the original developers may help improve understanding of menstrual cycle hormones and research findings.
Another important consideration is the type of assay selected. The studies in this review do not necessarily reflect recent developments in immunoassays, as many qualities have improved, including increased sensitivity, speed, and quality of analyte detection, with expanded field applications since the 2019 pandemic [47]. In particular, gas and liquid chromatography-mass spectrometry are measurement tools reported to have higher sensitivity and specificity, and spectrometry tools are noted to be more cost-effective and could be a better alternative to serum immunoassays [46–49]. Investigators should consider the research question, the type of hormone to be measured (i.e., bound vs. unbound, metabolite, etc.), measurement tool quality, standardization across relevant literature, and cost-effectiveness when deciding which methods to use for their study. It is beyond the scope of this scoping review to detail recent technical changes, particularly related to ovarian hormone measurements outside of a laboratory setting; however, it is important to remain mindful of these limitations when referring to the older studies included in this review.
Other observations from this review indicate that reporting methods were inconsistent across studies, with many failing to report means, standard deviations, and ranges for hormone values [9,12,24,25,26,28,30,34,36]. This further emphasizes the need for standardized methodological reporting, including menstrual cycle phase definitions, hormone values, and statistical and quality parameters, in menstrual cycle research.
Limitations
Due to variability in menstrual cycle definitions and research methods, synthesis and comparison of results were challenging and not definitive. Some articles may have contained conversion errors, which could partially explain differences in hormone values. Limited reporting of assay sensitivity, specificity, and inter-assay CVs restricted the assessment of assay quality and hormone levels. The studies included in this review did not specifically report statistical transformations of mean hormone values (i.e., log transformations). However, if certain assay brands inherently convert hormone values during analysis, this would not be apparent unless explicitly reported [46].
Conclusions
Sixteen studies were identified that addressed the use of salivary estradiol and progesterone, and urinary luteinizing hormone detection for menstrual cycle phase identification. Based on this scoping review, our recommendations for future menstrual cycle research include careful consideration of phase definitions and planning for quantitative identification of these phases using the 2021 standardized methods by Elliott-Sale et al. [13], as well as reporting hormone values with associated assay quality measures. Salivary hormone detection methods should be standardized and undergo validation testing when used for menstrual cycle hormone detection [13,18,48,49]. Implementing these recommendations may improve future research by allowing more accurate assessment of hormones and their physiological effects, with greater quality and consistency between studies [13].
This scoping review highlights the lack of studies focused on methodology for measuring hormones throughout the menstrual cycle and identifies inconsistencies in menstrual cycle phase definitions, methodologies, hormone values, and assay detection quality measures. There remains potential for differences in study findings when examining cycle phases and their associated hormones [37,50], due to the lack of standardized hormone testing protocols. Therefore, reporting hormone assay quality parameters, such as sensitivity, specificity, and inter- and intra-assay CVs, is crucial when conducting and interpreting menstrual cycle research [17,18,37].
The studies included in this review demonstrate the complexities of conducting and interpreting menstrual cycle research, while acknowledging recent advances that must be considered. These complexities highlight the need for standardized methodologies, particularly in menstrual cycle research, which were largely absent in the literature accessed for this review. Studies from the early 2000s identified in this review should be interpreted with caution, as assay methodologies have since shifted toward increased automation, miniaturization, and integration of new technologies, with greater emphasis on data quality and protocol standardization. Nevertheless, this scoping review provides evidence-informed support for hormone testing using salivary and urinary measurement methods. Depending on the research question, careful consideration should be given to the type of hormones tested (i.e. bound, unbound, metabolite), the resources available for the measurement type (saliva, urine, serum), the frequency of testing, and whether conducted in the laboratory or field setting.