Introduction
Gestational diabetes mellitus (GDM) is a worldwide healthcare problem. It is defined as any level of dysglycemia with onset or first acknowledgment during gestation [1-3]. The incidence of diabetes in pregnant women increased by 9% annually between 2011 and 2017 [4]. This prevalence is affected by several factors, namely obesity [5]. During pregnancy, there is also an adaptive physiological change in maternal body composition that helps support the fetus and prepare the mother for breastfeeding [6]. Indeed, fat mass (FM), lean mass or fat-free mass (FFM), and total body water mass (TBWM) increase in different ways, and their effects on newborns represent a major area of interest in perinatal medicine [7]. The present study aimed at studying changes in body composition during pregnancy and to investigate the relationship between the results of impedancemetry and the 75-g oral glucose tolerance test (OGTT) in pregnant women.
Methods
Subjects
We included 200 female volunteers aged between 18 and 45 years (150 pregnant women and 50 control women). Pregnant women were referred to our department for an OGTT as part of a screening for GDM. We excluded women with diseases or treatments known to have metabolic effect. Controls were healthy women part of our medical and paramedical staff. Those on oestro-progestogenic pills, and athletic women were excluded. For both groups, women with unknown pre-pregnancy weight and imprecise dates of the last menstrual period were also excluded.
Ethical approval
All women participating in this study had given consent for all questionnaires and exams conducted to be used for the study. No extra ethical approval was necessary since all exams were part of the systematical care services offered to women during pregnancy.
Questionnaire
Women were asked about their age, geographic location, and occupation. Personal medical histories were detailed. Risk factors for GDM were assessed according to the recommendations of the French College of Gynecologists and Obstetricians [8]: history of diabetes mellitus in first-degree relatives, maternal age > 35 years, body mass index (BMI) before pregnancy > 25 Kg/m², personal history of GDM, history of fetal macrosomia. Suggestive clinical signs of diabetes were also investigated.
Anthropometric measurements
Height, weight, hip circumference (HC), and uterine height (UH) were measured. BMI was calculated by dividing weight (Kg) by height (m) squared. Pre-pregnancy weight was provided by the interview or noted from the pregnancy follow-up notebook.
Obesity definition
According to WHO, obesity in pregnant women is defined by a BMI ≥ 30 Kg/m² referring to the woman's height and weight before pregnancy or those measured during the first prenatal visit if not available before pregnancy [9].
Impedancemetry
Impedancemetry corresponds to the analysis of the human body compartments. Bioelectrical impedance analysis, based on the capacity of tissues to conduct electrical energy, allows the measurement of the resistance of biological tissues by sending a sinusoidal electrical signal of low intensity and high frequency (10-100 kHz) through electrodes [10]. The impedancemeter used in this study was the Tanita TBF-410. The results provided by impedancemetry were BMI, weight, FM expressed in Kg, FFM expressed in Kg, TBWM expressed in Kg, and basal metabolic rate. The percentages of FM, FFM and TBWM were calculated according to the following formulas:
FM% = FM (Kg)/ total body weight x 100;
FFM % = 100% - FM %, TBWM% = (TBWM (Kg)/FFM (Kg)) x 100
OGTT for pregnant women
Pregnant women should have fasted 8 to 14 hours the day before the test without following a special diet. A first blood sample was taken before ingesting the glucose solution (T0 min). Then, women were asked to drink 250 ml of 30% concentrated glucose serum (equivalent to 75 g of glucose) in less than 5 minutes. Two more blood glucose tests were taken at T60 min and T120 min. The samples are mixed with Sodium Fluoride/Potassium Oxalate for prolonged storage (> 2 h) and glycolysis in vitro prevention.
The test was stopped in case of intolerance, fasting blood glucose ≥ 1.26 g/L (type 2 diabetes), blood glucose ≤ 0.70 g/L with clinical signs of hypoglycemia, or blood glucose < 0.54 g/L.
Diagnosis of GDM was confirmed if at least one value was greater than or equal to the standards: T0 min ≥ 0.92 g/L and/or T60 min ≥ 1.8 g/L and/or T120 min ≥ 1.53 g/L [7].
Statistical analysis
Statistical analysis was performed with the Statistical Package for the Social Sciences software (SPSS13). A descriptive study for qualitative and quantitative variables was performed. Normality of data distribution was checked with the Shapiro-Wilk test. For the analytical study, Chi 2 test, Student’s T test and ANOVA were used for normally distributed parameters. Fisher’s exact test, the Mann-Whitney U test and the Kruskal and Wallis tests were used for non-normally distributed parameters. Differences were considered statistically significant when the value of p was < 0.05.
Results
We divided our population into 3 groups: NGD: pregnant women without GDM (n=84), GD: pregnant women with GDM (n=66), and CG: control group (n=50). Data collection, OGTT and impedancemetry were performed at a mean term of 26 ±3.7 weeks of gestation.
General data
The 3 groups were comparable in terms of geographical origin and age. Most women of our population were housewives with no significant difference between the 3 groups.
Medical history
First degree familial diabetes was found higher in the GD group as compared to the NGD and CG groups (28% vs. 8.3% and 12.1%, respectively, p<0.01). The most common medical history was high blood pressure in the control population (n=6) and anemia in both groups of pregnant women (n=4). The 3 groups were comparable in the number of gestations and parity.
Anthropometric data
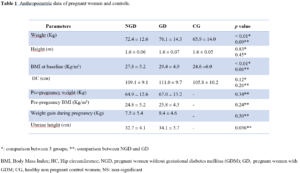
The 3 groups were matched for height. We did not find a significant difference between the pre-pregnancy weight in the first two groups compared to CG (NGD: 64.9±12.6 Kg, GD: 67.0±13.2 Kg, and CG: 65.9±14.0 Kg; p>0.05). However, a significant difference was found for baseline weight and baseline BMI (Table 1).
For all pregnant women pregnant women, 31.5% were overweight and 17.6% obese before pregnancy. The mean weight of the NGD group was lower than that of the GD group yet not significant (72.4±12.6 Kg vs. 76.1±14.3 Kg, respectively, p>0.05). There was no significant difference in gestational weight gain between both studied pregnant groups (NGD: 7.46±5.39 Kg and GD: 8.35±4.64 Kg, p>0.05).
Also, uterine height was significantly greater in GD women compared to NGD ones (32.7±4.1 cm vs. 34.1±3.6 cm, respectively, p<0.05). Table 1 summarizes the anthropometric data for the 3 groups.
Risk factors for GDM
Rate of risk factors for GDM were present among 60% of NGD and 74.2% of GD and were significantly higher, in number, among the GD group (1.34±1.08 vs. 0.98±1.02, respectively, p<0.05). Personal history of GDM was reported in 7.1% of NGD women and 16.7% of GD women. No significant difference was noted between the 2 groups of pregnant women for the following 2 risk factors: pre-pregnancy BMI>25 Kg/m² and maternal age > 35 years. However, we noted a positive correlation between BMI of pregnant women at baseline and weight gain (p<0.001; r=0.27).
Impedancemetry: interpretation of body composition
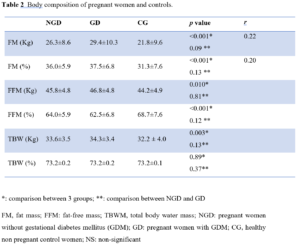
FM and FFM in percent of body mass and in kilograms were higher in GD than other groups with positive correlations. However, TBW was significantly different among the three groups only in Kg but not in percentage (Table 2). Uterine height and FM (%) were also positively correlated (p<0.001; r=0.77).
In pregnant women with a pre-pregnancy BMI<25 Kg/m², the percentage of FFM was higher compared to those who had overweight or were obese with, respectively, (67.4±5.2% vs. 59.2±4.1%, respectively, p<0.001). We noted a negative correlation between FFM (%) and weight gain (p<0.05; r=-0.20).
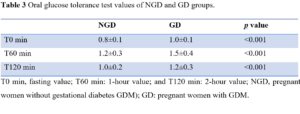
Diagnosis of GDM by OGTT: analysis of values
GDM was diagnosed in 44% of pregnant women based on high level of T0 blood glucose. The OGTT values according to the T0 min, T60 min, and T120 min schedule are shown in Table 3.
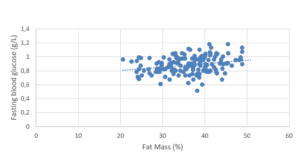
Fasting blood glucose values were positively correlated to age (p<0.05; r=0.25) and to pre-pregnancy BMI (p<0.05; r=0.18) (Figure 1). However, no significance was found for a BMI being superior to 25 Kg/m².
Relationship between OGTT results and impedancemetry results.
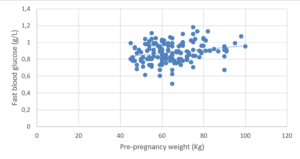
Blood glucose levels at T0 min were lower in pregnant women with a higher FFM (%) (p<0.05; r = -0.23). Pregnant women with higher FM (%) values had higher fasting blood glucose levels (p<0.05; r=0.23) (Figure 2).
Discussion
Body composition and pregnancy
Prevalence of obesity
A study published in 2018 showed that obesity rate has increased worldwide to 100 million among women of reproductive age, with 250 million classified as being overweight [9]. According to a Tunisian study published in 2012 and 2013, obesity among women was 37% [1,11,12]. In our study, 12.2% of women of CG were obese and 26.53% were overweight. For pregnant women, 17.6% were obese and 31.5% were overweight before pregnancy. This little decrease compared to general population, could be explained by the relatively young age of our population.
Changes in body composition during pregnancy
Among the pregnant women in our population, FM (%) was significantly higher than FFM (%). According to literature, all pregnant women display a gain in total weight, FM, and TBWM during pregnancy in similar percentages [6]. Pregnancy products account for approximately 35% of weight gain [13]. Catalano et al. [14] have shown that the increase of FM is mostly seen among thin women, situation that was also found in our study.
According to the literature, white adipose tissue represents up to 20-30% of body weight in non-obese and non-pregnant women [15]. In our study, the percentage of fat in control women was 31.3% and 36.8% in pregnant women. FFM increases during pregnancy with highly variable mean values [16]. In our study, we found that in pregnant women, FFM (Kg) increased compared to CG. However, we did not find a significant difference in FFM between NGD and GD women. We also found that TBWM (%) was comparable between the 3 studied groups. However, TBWM (Kg) was higher in pregnant women. According to Mbungu et al. [16], the evolution of pregnancy is characterized by a very significant increase in the TBWM during the last trimester of pregnancy, which is explained by the physiological retention of water that allows maternal body improve the utero-placental fetal flow.
GDM and pregnancy
Prevalence of GDM
According to the literature, the prevalence of GDM is difficult to estimate. It depends on the screening method and diagnostic criteria used in each country. Published global prevalence figures may range from 1.7% to 11.7% [17]. According to the latest estimation from the International Diabetes Federation in 2017, GDM affects about 14% of pregnancies worldwide, or about 18 million births per year, using IADPSG diagnostic criteria [18]. In the present study, the prevalence of GDM was 44%. In fact, pregnant women who were referred to our department for OGTT generally had risk factors for GDM. Our study is not based on the entire population of pregnant women, which may explain in part the relatively high prevalence of GDM.
Risk factors for GDM
Age was not correlated to GDM in our study when comparing 3 groups. However, it was positively correlated to glycemic values without a threshold. This can be related to variability of risk factors among societies. Actually, Farrar et al. [19] have shown that an age > 25 years is a risk factor for the prediction of GDM. Whereas, in a Malaysian study, women aged 35 or more were 2.5 times more likely to have GDM compared to those aged 25-34 years (26.3% vs. 9.7%) [20].
Women with a personal history of GDM face a higher risk of type 2 diabetes mellitus and metabolic syndrome later in life [15]. Women with GDM have a 7 times higher risk of developing type 2 diabetes after pregnancy. This relation could not be verified in our study since we did not follow-up on patients. Pre-pregnancy weight and BMI will be discussed in the next section.
Body composition and GMD
Relation between pre-pregnancy BMI and GDM
A meta-analysis published in 2019 showed that a high BMI before pregnancy is associated with a higher risk of developing GDM and that 24% of all gestational complications are attributed to maternal overweight and obesity [21]. This was not confirmed in the present study when comparing pre-pregnancy BMI between three groups but it was confirmed in terms of a positive correlation between pre-pregnancy BMI and blood glucose levels at T0 min, T60 min, and T120 min. However, we could not determine a threshold for BMI to be correlated to GDM as Farrar et al. [19] determined a BMI of 25 Kg/m2 to be a predictive factor of GDM. Pre-pregnancy BMI was the most important modifiable risk factor for GDM [22]. The meta-analysis by Torloni et al. [23] showed that an increase in BMI of 1 Kg/m2 increases the prevalence of GDM by 0.92% [23].
Relation between weight gain during pregnancy and GDM
Average weight gain of the pregnant women of our study at 26 weeks of gestation was 7.84 Kg, which corresponds to the same margins of weight gain set by the American Institute of Medicine [24]. However, this may be imprecise as the pre-pregnancy weight was self-reported by some pregnant women who did not have a pregnancy follow-up record. The weight gain in our study was lower in pregnant women with GDM as that reported by other studies [25].
Although we found no correlations between weight gain and GDM, a study conducted in 2016 showed that a weight gain of more than 7 Kg in the second trimester increases the risk of GDM by 2.6 times in women with a negative first trimester GDM screening result [26]. Hedderson et al. [27] also showed that excessive weight gain during pregnancy, particularly in the first trimester, is associated with an increased risk of GDM. According to this study, early gestational weight gain can lead to an early increase in insulin resistance, which leads to the depletion of beta cells of the pancreas that become unable to secrete adequate levels of insulin [27]. This discordance could be explained by the high rate of obesity before pregnancy in our population.
Relation between FM, FFM and GDM
A recent review conducted by Najafi et al. [28] revealed that the risk of GDM was higher among overweight/obese pregnant women, which seems to be mostly related to FM. According to Wang et al. [29] BMI and body fat are associated with an increased risk of type 2 diabetes in obese Chinese women with GD [20]. This was confirmed in our study as FM was positively correlated to glucose levels in all pregnant women, whereas women with high FFM had lower glucose levels. This could be explained by the changes in maternal insulin sensitivity during pregnancy that effect maternal accretion of adipose tissue and energy expenditure [30].
Conclusion
The present study found that obesity is a risk factor for GDM and confirmed that there is a relationship between glycemic values and body composition parameters in all pregnant women. Moreover, during pregnancy, several clinical and biological parameters, for example, the lipid balance, also undergo profound gestational changes and deserve to be carefully studied to ensure better management of pregnant women and their newborns.
Conflicts of interest: None