Introduction
Polycystic ovary syndrome (PCOS) is a very frequent gynecologic and endocrine disease that affects 5–25% of fertile women [1,2]. It is widely known that PCOS is diagnosed in the presence of at least 2 of the 3 diagnostic criteria established at the American Society for Reproductive Medicine and European Society for Human Reproduction and Embryology consensus meeting in Rotterdam [3]. However, in the last decade, the dysmetabolic state related to insulin resistance (IR) and the correlated compensatory hyperinsulinemia have been considered important additional aspects that need to be properly considered and evaluated [4,5].
In fact, it has been reported that PCOS patients, in addition to the endocrine impairment, frequently show overweight or obesity together with compensatory hyperinsulinemia due to IR. All these features are major risk factors for metabolic syndrome (MS) [6,7] and non-alcoholic fatty liver disease (NAFLD) [8]. The hepatic insulin extraction (HIE) index was recently evaluated in obese subjects, and it was shown to be positively correlated with IR [8,9]. The HIE index is a measure of the proportion of the insulin secreted from the pancreas that is removed by the liver before it can enter the systemic circulation, and it is usually computed as the ratio between the area under the curve (AUC) of insulin and the AUC of C-peptide (AUC Ins/AUC C-Pept) [10]. Recent studies clearly demonstrated that HIE is associated with muscle and adipose tissue IR other than with liver function that clears insulin from the blood [8]. All these factors together might trigger NAFLD and hepatic steatosis as recently reported [8,11].
HIE is usually computed as the AUC Ins/AUC C-Pept under the oral glucose tolerance test (OGTT), however this computation does not take into account changes in HIE throughout the OGTT. In fact, it has been reported that in normal subjects HIE is not constant during the OGTT [12].
For this reason, we set out to evaluate HIE along the OGTT in a population of overweight/obese PCOS patients, in baseline conditions, so as to better evaluate the dynamics of HIE in a population of patients that frequently have impaired insulin sensitivity.
Materials and Methods
Subjects
Among the patients attending the outpatient clinic of our department’s Gynecological Endocrinology Center between January 2019 and June 2021, and recorded in the Center’s outpatient database as PCOS, a total of 53 patients showing overweight/obesity [24.5 ± 1.8 years, mean ± standard error of the mean (SEM)] was selected.
All these patients required treatment for their PCOS condition and met the relevant diagnostic criteria established by the American Society for Reproductive Medicine and the European Society for Human Reproduction and Embryology [3]; accordingly, at least two of the following criteria were present: (a) oligomenorrhea with inter-menstrual intervals longer than 45 days, (b) clinical (acne, hirsutism) or biochemical signs of hyperandrogenism, (c) presence of micro-polycystic ovaries on ultrasound examination.
The patients also had to fulfil the following criteria: (d) absence of enzymatic adrenal deficiency and/or other endocrine disease, including diabetes, (e) normal prolactin (PRL) levels (range 5-25 ng/ml), (f) no hormonal treatment or insulin sensitizer drugs during a period of at least 6 months prior to the study, (g) body mass index (BMI) above 27.
All the patients, at the first consultation (history taking), were interviewed to establish whether they had one or more first-degree relatives (parents and/or grandparents) with diabetes. The anamnestic investigation revealed that 31 of the 53 patients (59.6%) reported first-degree diabetic relatives.
Informed consent was obtained from all individual participants, as a standard procedure of the Gynecological Endocrinology Center of the University of Modena and Reggio Emilia, Italy, after which they were evaluated for levels of luteinizing hormone (LH), follicle-stimulating hormone (FSH), estradiol (E2), progesterone (P), androstenedione (A), insulin, glutamic aspartate amino transferase (AST), and alanine amino transferase (ALT). The HOMA index was computed to estimate sensitivity to insulin [13]. An oral glucose tolerance test (OGTT), for insulin, C-peptide and glucose determinations, was performed sampling before and at 30, 60, 90, 120, 180 and 240 min after oral intake of 75 g of glucose. A hyperinsulinemic response is recognized when plasma insulin levels are above 50 μU/ml within 90 min of the glucose load [14]. In addition, consideration was given also to baseline plasma insulin levels, since a plasma insulin level of 12 μU/ml or higher is considered an index of IR [14,15].
After the endocrine evaluation, all the patients were prescribed a treatment based both on the clinical findings and their aims and desires. For the purposes of the present study, only the baseline evaluation, performed by all these patients, was considered.
According to the presence of familial diabetes, the whole set of PCOS patients was divided in two groups: PCOS with familial diabetes (n=31) and PCOS without familial diabetes (n=22). Both groups were then considered on the basis of the presence or absence of a hypersulinemic response to the OGTT, as well as their plasma fasting insulin levels, that is insulin ≤ 12 μU/ml (n = 22)] and insulin > 12 μU/ml (n= 31), as previously reported [14,16].
Assay
All samples from each subject were assayed in the same assay. Plasma LH and FSH concentrations were determined using a previously described immunofluorometric assay [16,17]. The sensitivity of the assay, expressed as the minimal detectable dose, was 0.1 IU/ml. The cross-reactivities with free and ß-subunits of LH, FSH and thyroid-stimulating hormone (TSH) were less than 2%. Intra-assay and inter-assay coefficients of variation were 4.2% and 6.3%, respectively. Plasma E2, A, and cortisol levels were determined by commercially available assay systems. Based on two quality control samples, the average within- and between-assay coefficients of variation were 3.7% and 8.2%.
Plasma insulin and C-peptide concentrations were determined using an immunoradiometric assay (Biosource Europa S.A., Nivelles, Belgium). Based on two quality control samples, the average within- and between-assay coefficients of variation were 4.0% and 10.2%.
Statistical evaluation
After analysis of variance (one-way ANOVA), data were tested for statistically significant differences between the groups by means of Student’s t-test for paired and unpaired data, as appropriate.
Chi-square test was computed to test for any statistically significant difference between the expected and the observed frequencies in one or more categories of our PCOS patients under evaluation.
The HOMA index was computed to estimate sensitivity to insulin [13] since it is considered the main index of IR and MS, and a common link between the coexisting abnormalities; it can be calculated by homeostasis model assessment of IR (HOMA-IR) as (fasting insulin mU/l) × (fasting glucose mmol/l)/22.5 [20]. We used the previously established cut-off value of 2.7 [13].
The HIE index was computed as the ratio between plasma insulin and C-peptide concentrations (insulin/C-peptide) [10] for each sample of the OGTT. This evaluation aimed to evaluate the dynamic changes in HIE along the entire OGTT.
Data are expressed as mean ± SEM.
Results
To better outline the results, we present them according to the groups identified in the PCOS population under study. For this purpose, the results are presented according to presence/absence of familial diabetes and according to the concomitant presence/absence of plasma insulin levels above 12 μU/ml and/or of a response higher than 50 μU/ml on the OGTT.
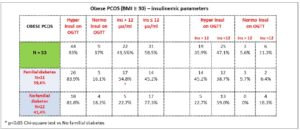
Figure 1 shows the subgroups identified among the PCOS patients. Only the frequency of plasma insulin levels above 12 μU/ml was significantly higher (p<0.05, Chi square test) in the group of PCOS patients with familial diabetes
PCOS with/without familial diabetes
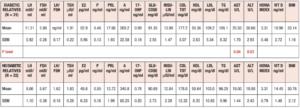
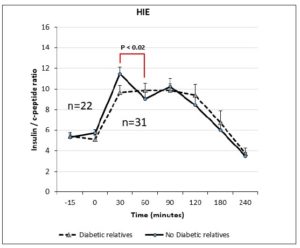
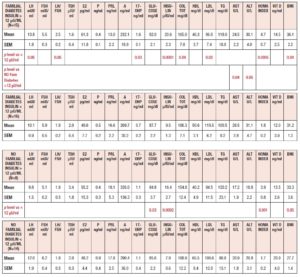
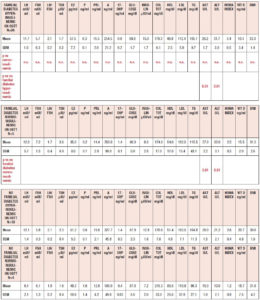
Table 1 summarizes the hormonal and metabolic characteristics of the PCOS patients divided according the presence or absence of familial diabetes. The two groups are homogenous and the only difference is in the plasma AST and ALT levels, which were higher in the PCOS patients with familial diabetes. When HIE profiles were drawn, the profile of patients without familial diabetes was found to differ from that observed in patients with familial diabetes. This difference is linked to the fact that HIE was significantly reduced (p<0.02) at 60 minutes in the OGTT in the PCOS patients without familial diabetes. This pattern was not observed in PCOS patients with familial diabetes (Fig. 2).
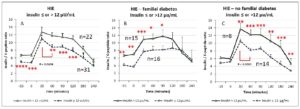
PCOS with baseline insulin plasma levels ≤ or > 12 μU/ml
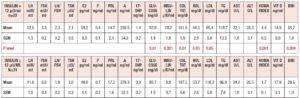
Table 2 summarizes the hormonal and metabolic characteristics of the PCOS patients considered according to their baseline levels of insulin (above or below 12 μU/ml). Interestingly, although the hormone profile results were similar, most of the metabolic parameters differed significantly, being higher in PCOS patients with plasma insulin levels > 12 μU/ml.
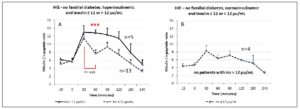
When considering the HIE profiles under OGTT, the patients with familial diabetes showed higher HIE at many timepoints of the test, including -15 min and 0, that is before the glucose load. In addition, the patients with insulin ≤ 12 μU/ml showed a significant reduction in HIE at 60 min (p<0.0008) (Fig. 3, panel A).
PCOS with/without familial diabetes and with baseline insulin plasma levels ≤ or > 12 μU/ml
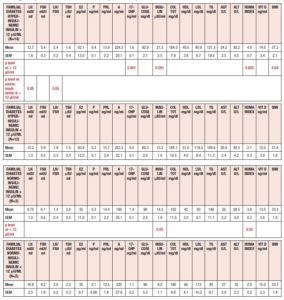
Table 3 summarizes the hormonal and metabolic characteristics of the PCOS patients considered according to the presence or absence of familial diabetes, as well as their baseline levels of insulin (above or below 12 μU/ml). PCOS patients with familial diabetes and baseline levels of insulin above 12 μU/ml showed higher plasma LH, 17OHP, insulin, total cholesterol, and LDL levels, and higher HOMA index and BMI values than PCOS patients without familial diabetes and with baseline levels of insulin below 12 μU/ml. Interestingly, PCOS patients with familial diabetes and with baseline levels of insulin above 12 μU/ml showed higher plasma AST and ALT levels than PCOS patients without familial diabetes and with baseline levels of insulin above 12 μU/ml. The PCOS patients without familial diabetes and with baseline levels of insulin above 12 μU/ml recorded higher plasma levels of glucose and insulin and higher HOMA index and BMI values than the PCOS patients without familial diabetes and with baseline insulin levels below 12 μU/ml.
When considering HIE profiles under OGTT, the PCOS patients with familial diabetes showed significant differences according to the baseline levels of insulin (Fig. 3 panel B). Interestingly, the HIE profile shapes were markedly different from those observed for PCOS patients without familial diabetes (Fig. 3, panel C), being smoother in the presence of familial diabetes than in the cases with no familial diabetes. Within this latter group, the HIE profile in subjects with insulin ≤12 μU/ml was sharper and showed a rapid significant decrease from 30 min to 60 min of the OGTT (Fig. 3, panel C).
PCOS with normo or hyperinsulinemic response on the OGTT
Table 4 summarizes the hormonal and metabolic characteristics of the PCOS patients considered according to the presence or absence of a hyperinsulinemic response to OGTT. As reported in Fig. 1 the patients showing an insulin response higher than 50 μU/ml within 90 min of the glucose load numbered 44 (83%), and only 9 (17%) showed responses within the normal limits. Those showing a hyperinsulinemic response to glucose load were significantly different from the normoinsulinemic response group in several hormonal and metabolic parameters. In fact, the hyperinsulinemic subjects showed higher plasma LH, insulin, AST and ALT values and a higher HOMA index, and lower HDL levels than normoinsulinemic subjects (Table 4).
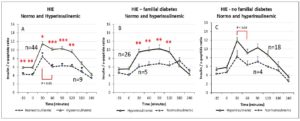
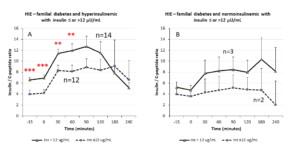
When considering HIE profiles under OGTT, hyperinsulinemic PCOS patients showed higher HIE values than the normoinsulinemic PCOS group. This latter group showed a sharp and significant decrease in HIE at time 60 min of the OGTT (p<0.01) that was not observed in the other group (Fig. 4, panel A).
PCOS with/without familial diabetes and with normo or hyperinsulinemic response on the OGTT
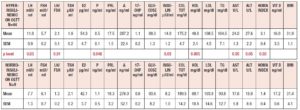
Table 5 summarizes the hormonal and metabolic characteristics of the PCOS patients considered according to the presence or absence of familial diabetes and a normo or hyperinsulinemic response to the OGTT. It is of note that when familial diabetes was absent, no differences were observed according to the insulin response to OGTT. Conversely, the patients with familial diabetes, independently of the response to the OGTT, showed higher AST and ALT values than the corresponding groups of PCOS without familial diabetes.
When considering HIE profiles under OGTT, the PCOS patients with familial diabetes and hyperinsulinemic response to OGTT showed higher HIE values along the entire OGTT curve than the normoinsulinemic PCOS patients with familial diabetes (Fig. 4 panel B). Conversely, no significant differences were observed for PCOS without familial diabetes with or without hyperinsulinemic response to OGTT (Fig. 4 panel C). Interestingly, in PCOS without familial diabetes a significant decrease of HIE at 60 minutes of the OGTT (p<0.03) was observed in hyperinsulinemic group. Normoinsulinemic PCOS showed a decrease at 60 minutes of OGTT but this did not reach significance due to the few subjects in the group (Fig. 4 panel C).
PCOS patients with familial diabetes, with normo or hyperinsulinemic response to OGTT with baseline insulin levels > 12 µU/ml or ≤ 12 µU/ml
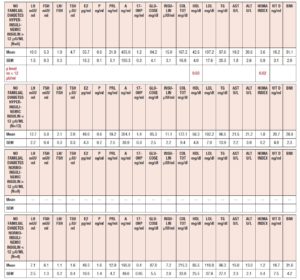
Table 6 summarizes the hormonal and metabolic parameters of PCOS patients with familial diabetes according to insulin response to OGTT and to insulin baseline levels > 12 µU/ml or ≤ 12 µU/ml. Hyperinsulinemic PCOS patients with baseline insulin levels > 12 µU/ml showed higher insulin plasma levels, BMI and HOMA index values than those with insulin baseline levels ≤ 12 µU/ml and higher LH plasma levels than normoinsulinemic PCOS with insulin plasma levels > 12 µU/ml (Table 6).
When considering HIE profiles under OGTT, PCOS patients with familial diabetes with insulin baseline levels > 12 µU/ml had significantly higher HIE values than those with insulin ≤ 12 µU/ml (Fig. 5 panel A). No significant differences were observed in case of normoinsulinemic PCOS with familial diabetes between those with insulin levels > 12 µU/ml and ≤ 12 µU/ml (Fig. 5 panel B).
PCOS patients without familial diabetes, with normo or hyperinsulinemic response to OGTT with baseline insulin level > 12 µU/ml or ≤ 12 µU/ml
Table 7 summarizes the hormonal and metabolic parameters of PCOS patients without familial diabetes according to insulin response to OGTT and to insulin baseline levels > 12 µU/ml or ≤ 12 µU/ml. Hyperinsulinemic patients with baseline insulin levels > 12 µU/ml showed only a higher HOMA index and lower HDL level when compared with those with insulin ≤ 12 µU/ml (Fig. 6 panel A). Among the normoinsulinemic PCOS patients there were no subjects with insulin levels > 12 µU/ml.
When considering HIE profiles under OGTT, hyperinsulinemic PCOS patients with baseline insulin levels > 12 µU/ml showed higher HIE values than those with insulin ≤ 12 µU/ml (Fig. 6 panel A). The hyperinsulinemic PCOS patients showed a significant decrease in HIE at 60 min (Fig. 6 panel A), similarly to other groups.
Discussion
The present study is a first attempt to evaluate HIE under OGTT in a group of overweight/obese PCOS subjects according to the presence/absence of familial diabetes and metabolic parameters such as baseline insulinemia and insulin response to OGTT.
Our data show that in overweight/obese PCOS, the presence of familial diabetes predisposes patients to show higher plasma ALT and AST levels and compensatory hyperinsulinemia, known to occur very frequently in PCOS [18]. While not pathological, these raised transaminase levels, together with IR, support what was previously reported by Polyzos et al. [11], namely that the presence of overweight/obesity together with IR triggers a higher risk of NAFLD, and the risk of hepatic steatosis and fibrosis and MS too.
Fasting insulin above 12 µU/ml is an indicator of IR [14,15], and when the PCOS patients were considered on the basis of the presence or absence of familial diabetes and, at the same time, of insulin levels above or below 12 µU/ml, our data clearly showed that insulinemia above 12 µU/ml occurred significantly more frequently in patients with familial diabetes. In addition, we found that, in cases of familial diabetes and insulin plasma levels > 12 µU/ml, the lipid profile and HOMA index were higher than in patients with insulin levels ≤ 12 µU/ml, confirming what was reported by Lunger et al. [15], namely that abnormal baseline insulin correlates with an abnormal lipid profile.
It is interesting to note that when our PCOS patients were considered according to the insulin response to the glucose load, 83% showed an insulin response higher than 50 µU/ml [14], similarly to what has previously been reported [19]. These hyperinsulinemic PCOS patients showed higher hormonal and metabolic parameters than the normoinsulinemic PCOS group. In fact, they had not only higher insulinemia, but also higher LH, AST, ALT and HOMA index values, although their BMI was similar to that seen in the normoinsulinemic patients. This observation is fundamental since it allows us to see that insulin response to glucose load, when it reaches high levels, is an essential index for suspecting impairment both of metabolism and of reproductive function. On the basis of this observation, obesity does not seem to be the only clinical index pointing to the presence of impaired metabolism in PCOS patients. This link between insulin and reproduction has recently been demonstrated in oligomenorrheic PCOS patients, who showed higher plasma LH and kisspeptin levels and temporally uncoupled LH and kisspeptin pulsatile secretion due to the negative modulation of insulin on KNDy neurons [20,21]. Our present observation confirms these data and shows that higher baseline insulin in the fasting condition and/or in response to OGTT corresponds to a higher presence of profiles of impaired reproduction and metabolism.
When PCOS patients were evaluated considering the presence of an insulin response to the OGTT above the cutoff of 50 µU/ml [14], and at the same time according to the presence or absence of familial predisposition to diabetes, all subjects with familial diabetes again showed higher plasma AST and ALT levels. In addition, the concomitance of familial diabetes with high insulin response to the OGTT and baseline levels of insulin > 12 µU/ml is coupled with plasma ALT and AST levels at the upper limit of normality.
These observations are in agreement with a previous report that demonstrated that liver impairment and steatosis risk are associated with muscle and adipose tissue IR [8]. Our data showed an additional fact: we found that AST and ALT levels were high only in PCOS patients with familial diabetes, which supports the concept that familial diabetes, at a higher grade, predisposes to impaired (albeit still within normal limits) hepatocyte function. This idea is further strengthened by the fact that the PCOS patients without familial diabetes did not show this elevation of insulin response to OGTT, even though some showed responses above the cutoff of 50 µU/ml, independently of baseline insulin levels (≤ or > 12 µU/ml).
Practically speaking, our data show that PCOS patients with familial diabetes have non-optimal liver function, as indicated by higher AST and ALT levels, and that this is frequently associated with high baseline insulin levels and an insulin response to OGTT higher than 50 µU/ml. All these aspects are recognized as predisposing factors not only to MS [6] but also to NAFLD and liver steatosis [8,11]. In fact, NAFLD is very frequent in PCOS patients, and the combination of PCOS with obesity and IR is a dangerous cocktail that, over time, triggers not only NALFD but also the occurrence of type II diabetes, to which almost 60% of our PCOS patients had a familial predisposition [22,23].
To better understand liver function and its relationship with IR we also evaluated the HIE index [10]. This index reflects the dynamics of both insulin and C-peptide secretion and metabolic clearance.
Insulin is secreted by pancreatic cells of Langerhans islets and after proinsulin is synthesized and located in the beta-granules in the Golgi apparatus [24], the C-peptide is cleaved and disulphide bonds, bind the A-chain and B-chain together thus structuring insulin. While hepatic extraction of C-peptide, unlike that of insulin, is negligible and reflects the β-cell secretory capacity [25, 26], the majority of insulin is cleared by the liver [25]. It is evident that although the production ratio between insulin and C-peptide is theoretically 1, the ratio computed between plasma insulin and C-peptide concentrations greatly reflects the clearance kinetics of both peptides, and represents an index between circulating insulin and its release from the pancreatic cells, this last represented by C peptide.
This ratio cannot be equal to 1 both in physiological and pathophysiological conditions. In fact, catheterization of the hepatic artery that enters the liver showed that the amounts of C-peptide and insulin were qualitatively similar, but after the hepatic filter this ratio decreases [12]. To better understand the role of liver extraction of insulin, it is necessary to describe how, physiologically, the pancreas responds to glucose load [27]. Usually, in fasting condition, there is basal insulin secretion. As soon as β-cells are exposed to the increase in glucose there is a rapid release of insulin. This first-phase secretion occurs within 5-10 min of this exposure and it is followed by a decline in insulin secretion within 15-30 minutes, as shown by a rapid decrease in plasma insulin levels [27]. After this acute response there is a second phase of insulin secretion, during which the secretion rises more gradually and slowly than in the first phase and is directly related to the duration of the glycemic stimulus [27, 28]. Recent studies report that β-cells contain two distinct pools of insulin granules: a small labile pool (2% of the insulin produced) for the immediate release (first-phase) and a larger (98%) stable pool that is released slowly (second-phase) [28, 29].
When blood is sampled directly from the portal vein, the biphasic insulin response is well defined [27], but when only peripheral sampling is available, the biphasic insulin response is delayed and partly dampened due to the passage through the liver and distribution in the peripheral blood [27]. In normal subjects the shape of the insulin response to the glucose load (OGTT) shows this bimodal response, with a quick increase followed by a reduction and a subsequent increase, corresponding to the second phase. The repeated blood sampling during the OGTT is crucial to highlight this bimodal response, and the more frequent the sampling is, the better it is able to show this phenomenon. With a standard OGTT, the two phases can be seen at around 30–60 minutes from the glucose ingestion. The drop in the first-phase plasma insulin concentrations represents the combined effect of the end of the rapid insulin secretion (first phase) and the insulin clearance and degradation performed by the liver. This decline is immediately followed by the second-phase rise [27].
On this basis, the HIE index computed as the ratio between plasma insulin and C-peptide concentrations is able to show how insulin dynamics depend on liver function, since C-peptide levels reflect the secretory capacity of the β-cells [25], given that hepatic extraction of C-peptide, unlike that of insulin, is negligible [26]. In fact, C-peptide secretion did not differ between PCOS and control subjects, thus suggesting that peripheral hyperinsulinemia in PCOS patients could be due to lowered insulin extraction at the liver level [9] rather than to IR in skeletal muscles [30]. In fact, similarly to the hyperinsulinemia typical of obese patients [12], this pattern changed in the hepatic vein also in PCOS, reflecting the liver extraction of insulin [12].
Our data support this evidence and demonstrate that this situation is greatly related to familial diabetes since the PCOS patients with a family history of diabetes did not show any HIE decrease 30-60 minutes after OGTT. This observation suggests that insulin clearance by the liver is somehow reduced, leaving a higher amount of insulin uncleared and still circulating in the blood, in addition to that dynamically secreted by the pancreatic islets exposed to glucose stimulation. In addition, our data showed that this occurred especially in the familial diabetes cases and it was increased in the presence of a hyperinsulinemic response to the OGTT and/or when baseline insulin levels were > 12 µU/ml. In fact, the PCOS patients with no familial diabetes showed an HIE profile that was consistently different in shape from that of the patients with familial diabetes. In the former, the first phase of the insulin response was clearly distinct from the second phase and not dampened by the reduced hepatic clearance, as instead occurred in the presence of familial diabetes.
It is of interest to note that only a few of the PCOS patients without familial diabetes showed a hyperinsulinemic response to OGTT coupled with baseline plasma insulin levels above 12 µU/ml. In these patients, a dampened HIE curve was observed, masking the two phases of insulin secretion. This allowed us to infer that a certain degree of liver function impairment can also occur in PCOS without familial diabetes, leading to reduced insulin clearance, even in presence of normal ALT and AST levels. This observation suggests that both hyperinsulinism and the dysmetabolic state due to obesity negatively impair liver function.
Our data confirm the finding of Peiris et al. [30] and support the hypothesis that a specific differential liver ability in degrading insulin participates in the maintenance of IR and drives the hyperinsulinemic condition in PCOS patients, particularly in the presence of familial diabetes. Since these patients also have plasma AST and ALT levels at the upper limits of normality, higher than those in patients without familial diabetes, our data suggest that familial diabetes predisposes to impaired liver function, as previously reported [6,8,11]. Our data support the fact that familial diabetes and overweight/obesity trigger impaired synthesis/expression of the insulin degrading enzyme, as previously reported [9,31]. This situation could be at the basis of the reduced clearance of insulin, thus contributing to the hyperinsulinemic condition of PCOS.
In conclusion, our data suggest that the compensatory hyperinsulinemia in overweight/obese PCOS is due not only to reduced peripheral insulin sensitivity, but also to reduced hepatic insulin clearance as demonstrated by the dampened decrease in insulin after the first-phase secretion, a finding disclosed by HIE computation. Fasting plasma insulin levels above 12 µU/ml are a significant index of IR, similarly to the hyperinsulinemic response to OGTT, especially in PCOS with familial diabetes. According to the findings of the present study, familial diabetes is a serious predisposing factor that, together with other pathophysiological conditions still induced by familial diabetes (i.e., abnormal endogenous inositol and/or alpha lipoic acid synthesis/expression) [18], creates the conditions for triggering/maintaining IR.
Conflict of interest
The authors declare no conflict of interest