Introduction
Polycystic ovary syndrome (PCOS), which is common worldwide, is an endocrine condition characterized by chronic anovulation, clinical and/or biochemical hyperandrogenism, and/or polycystic ovaries [1]. Many experts consider hyperandrogenism to be the main characteristic of PCOS. Several theories propound different mechanisms to explain PCOS manifestations: (i) a primary enzymatic defect in ovarian and/or adrenal steroidogenesis; (ii) an impairment of gonadotropin-releasing hormone (GnRH) secretion that increases luteinizing hormone (LH) secretion; or (iii) alterations in insulin actions that lead to insulin resistance (IR) resulting in hyperinsulinemia. However, over recent years there has been growing evidence suggesting that defects in insulin actions or in the insulin signaling pathways play a principal role in the pathogenesis of the syndrome. Hyperinsulinemia stimulates both ovarian (mainly) and adrenal androgen secretion and suppresses sex-hormone binding globulin synthesis by the liver, and thereby results in hyperandrogenemia (HA) [2]. How insulin regulates androgenesis is not well understood. Clinical differences are observed between different ethnic groups of PCOS women. Consistent with this view, obesity and hirsutism are more prevalent in PCOS women from the US and Italy than in Japanese women with PCOS. Regardless of these differences, women with PCOS from all three countries manifested IR and hyperinsulinemia. These common findings across multiple ethnic groups suggest that hyperinsulinemic IR is a universal feature of PCOS [3].
It is unlikely that the IR of PCOS occurs as a result of hyperandrogenemia. Previous studies found that women who had undergone either subtotal or total removal of the ovaries, or in whom ovarian androgen production had been suppressed with the use of a long-acting GnRH agonist, showed persistence of IR [4-6]. Furthermore, elevated serum androgen concentrations do not appear until several years following the diagnosis of IR, even in prepubertal girls with acanthosis nigricans with increased insulin levels [7]. Moreover, some women with point mutations in the insulin receptor gene causing hyperinsulinemic IR have been shown to have PCOS [8,9]. On the other hand, normal men have androgen concentrations 10–30-fold higher than those of women, but they do not demonstrate IR. Collectively, these observations support the concept that the hyperinsulinemia of PCOS may be a causal factor for the hyperandrogenism in this syndrome. The present study aims to analyze the relations between IR and HA in PCOS.
Methods
Subjects and protocol
This cross-sectional study was conducted in the department of Endocrinology at Bangabandhu Sheikh Mujib Medical University (BSMMU). It involved 366 women with PCOS who fulfilled the revised Rotterdam criteria for PCOS, i.e., who showed at least two of the following three features: ovulatory dysfunction, clinical hyperandrogenism/HA, polycystic ovary morphology (PCOM). In all the study participants, hypothyroidism, hyperprolactinemia, non-classical congenital adrenal hyperplasia, primary amenorrhea, etc., were excluded on the basis of clinical features and appropriate investigations. Personal (menstrual abnormality, menstrual regulation or abortion and subfertility) and family (obesity, diabetes mellitus, subfertility and PCOS) histories were collected through direct consultation. Height, weight, waist circumference (WC) and blood pressure were measured with standard procedures. Informed written consent was taken from each participant and the protocol was approved by the BSMMU Institutional Review Board.
General obesity, central obesity, hypertension and hirsutism were defined by: body mass index (BMI) ≥25 kg/m2, WC ≥80 cm, blood pressure (BP) ≥140/90 mm-Hg, and Ferriman-Gallwey (F-G) score ≥8 respectively. The cut-offs to define HA, high IR and altered ratio of LH to follicle-stimulating hormone (FSH) (LH:FSH ratio) were respectively >46 ng/dl, 2.6 and >2:1 [10,11]. PCOM was considered present if either the volume (>10 ml) or follicle number (≥12 follicles measuring 2–9 mm) criteria were met in at least one ovary.
Patients were asked to attend the department one morning (after at least 8 hours of fasting) during the 2nd to 5th day of menstruation, or, in those with amenorrhea, on a convenient day. About 10 ml blood was collected by venipuncture from the antecubital vein. Glucose was measured on the same day. Serum was separated and stored in a –20°C refrigerator until assay.
Analytic methods
Fasting insulin, total testosterone (TT), LH and FSH were measured by chemiluminescent microparticle immunoassay (SEIMENS ADVIA Centaur XP, USA), and glucose by the glucose oxidase method. Insulin resistance was measured by the homeostasis model assessment of IR (HOMA-IR), which was calculated using the following equation: HOMA-IR= (fasting plasma glucose in mmol/L × fasting insulin in µIU/ml) ÷ 22.5. Ultrasonography for ovarian volume and specific sized follicle number was done during the follicular phase by abdominal or transvaginal approach, depending on the participant’s marital status and choice.
Statistical analysis
Data were analyzed using the SPSS program, version 23.0. Qualitative variables were expressed as frequency (percentages, %). Quantitative variables were checked for distribution. Normally distributed variables (age, BMI, WC, systolic and diastolic BP, serum TT) were expressed as mean values (±SD), while skewed variables (fasting blood glucose, serum LH, LH:FSH ratio and HOMA-IR) were expressed as median (interquartile range, IQR) values. The association between qualitative variables was assessed by Chi-square test. For quantitative values, association was tested by independent-sample T-test or Mann-Whitney U test and Kruskal-Wallis test, depending on their distribution. Spearman analysis was done to measure correlations between HOMA-IR and other quantitative clinical and biochemical variables. Binary logistic regression analysis was done considering IR status as the dependent variable. Receiver operating characteristics (ROC) curve was analyzed to see whether serum TT was a discriminator of IR status. P <0.05 was considered statistically significant.
Results
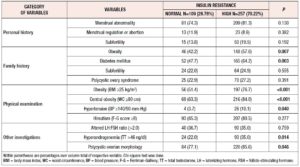
This study included 366 Bangladeshi women of reproductive age affected by PCOS [age: 22.91±4.91 years, BMI: 28.15±5.46 kg/m2 (mean±SD)]. More than 70% had high IR, determined considering a HOMA-IR cut-off of 2.6. Clinically, they had more metabolic abnormalities (general obesity: 76.7% vs. 51.4%, p <0.001; central obesity: 84.0% vs. 63.3%, p <0.001 and hypertension: 10.1% vs. 3.7%, p= 0.040) than the normal IR group. Family histories of obesity (57.6% vs. 42.2%, p= 0.007) and diabetes mellitus (DM) (64.2% vs. 47.7%, p= 0.003) were also statistically more frequent in these women. However, no statistically significant differences were found in other aspects of personal history, in family history or in hirsutism score. Among the other investigations, the patients with high IR were found to have higher frequency of hyperandrogenemia (35.0% vs. 22.0%, p= 0.014) and PCOM (85.6% vs. 77.1%, p= 0.046) (Table 1).
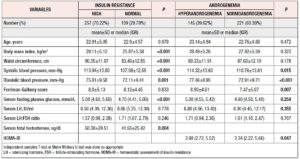
Similarly, the mean value of serum TT (normal IR vs. high IR: 41.55±25.42 vs. 50.38±29.51 ng/dl, p= 0.004) and the median value of fasting blood glucose were significantly higher in patients with high IR (normal IR vs. high IR: 4.70 vs. 5.08; p <0.001). However, the median values of serum LH (8.66 vs. 8.55 IU/ml; p= 0.778), LH:FSH ratio (1.71 vs. 1.57, p= 0.246), and frequency of altered LH:FSH ratio (36.7% vs. 35.0%, p= 0.759) were not statistically different between the IR status groups. Approximately 40% of PCOS women were found to have higher androgen levels on application of a cut-off of TT >46 ng/dl. Age, BMI and WC were not significantly different (NS for all) between groups, but hyperandrogenic women had significantly higher BP and HOMA-IR (3.98 vs. 3.34, p= 0.047) (Table 2).
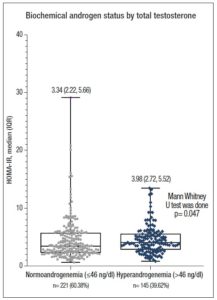
Figure 1 shows the distribution of serum HOMA-IR levels according to androgen status in the study population. The median value of HOMA-IR was significantly higher in patients with HA than in the women with normoandrogenemia [3.98 (2.72, 5.52) vs. 3.34 (2.22, 5.66); p= 0.047].
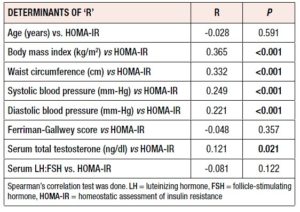
Table 3 shows that HOMA-IR significantly correlated with BMI (r= 0.365, p <0.001), WC (r= 0.332, p <0.001), systolic and diastolic BP (r= 0.249, p <0.001, r= 0.221, p <0.001) and TT level (r= 0.121, p= 0.021). Age, F-G score and LH:FSH ratio did not show any significant correlations (NS for all).
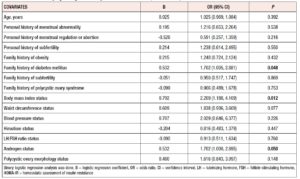
Binary logistic regression analysis revealed that BMI [OR (95% CI)= 2.209 (1.188, 4.109), p= 0.012], family history of diabetes mellitus [OR (95% CI)= 1.702 (1.005, 2.881), p= 0.048], and serum androgen level [OR (95% CI)= 1.702 (1.000, 2.895), p= 0.05] were independently related to HOMA-IR and could be considered predictors to some extent (Table 4).
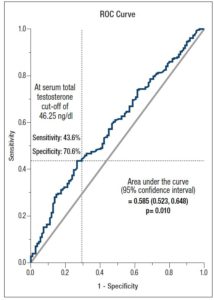
ROC curve analysis showed that TT can be considered a discriminator for IR (HOMA-IR ≥ 2.6) with an acceptable significance level (AUC= 0.585, p= 0.010), with a sensitivity of 43.6% and specificity of 70.6%, applying a TT cut-off of 46.25 ng/dl (Figure 2).
Discussion
In the present study, the link between IR and hyperandrogenemia was investigated in a cross-sectional analysis of 366 PCOS women. We found that biochemical HA, evidenced by TT level, was associated with higher IR and was able to predict IR independently. Using the HOMA-IR calculation to estimate IR we observed that 70% of the PCOS patients were insulin resistant. This is consistent with the findings of Carmina and Lobo, 2004 who studied 267 PCOS subjects and 50 control women: in their entire group of PCOS women, IR was detected in 65.4% with the glucose:insulin ratio, and in 77% and 79.2% of women with HOMA and quantitative insulin sensitivity check index (QUICKI) scores respectively [12].
In the present study, the median value of HOMA-IR was significantly raised in the hyperandrogenic group, although mean age and BMI in this group were similar to the values recorded in the normoandrogenic group. Burghen et al. 1980 were the first to suggest a relationship between IR and hyperandrogenemia after evaluating this aspect in a small group of patients [13]. Subsequently, IR was established as the main pathogenic factor in PCOS, although glucose intolerance is not always associated in the majority. Both impaired fasting glucose (IFG) and impaired glucose tolerance (IGT) are manifestations of IR, although levels in the liver, the main organ of IR, differ between these two prediabetes categories: IFG is characterized by severe hepatic IR with slight IR in the skeletal muscle, whereas IGT is characterized by severe IR in the skeletal muscle and moderate hepatic IR. HOMA-IR mainly reflects hepatic IR [14]. In our study, we found a significantly increased level of fasting plasma glucose (FPG) in the high IR group, which reflects the contribution of fasting glucose in IR. However, this study did not further investigate the association with IGT. When the same population was divided into normoandrogenic and hyperandrogenic groups by serum TT cut-off level, we did not find any significant difference in fasting glucose level. In the hyperandrogenic group HOMA-IR was higher and differed significantly from the value of the normoandrogenic group. This may suggest that testosterone has an independent relation with IR. We also observed a statistically significant correlation between HOMA-IR and TT, which is consistent with previous studies [15,16]. Serum TT might be a predictor of IR and it can acceptably discriminate HOMA-IR in PCOS patients.
In our study we also found that patients with high IR were more obese and had a greater degree of central obesity. Their systolic and diastolic BP were also higher than in the normal IR group, which is consistent with other studies [17]. About 9% of our study population had hypertension and mean values of both systolic and diastolic BP were significantly raised in the hyperandrogenic and hyperinsulinemic group, indicating their relation with arterial hypertension [18]. Obesity is an important contributing factor in IR, however we did not compare our data with obese healthy control data. Furthermore, we did not calculate the free androgen index or use the euglycemic clamp method, which are more sensitive methods for hyperandrogenemia and hyperinsulinemia studies respectively. Some authorities have also suggested that free testosterone and androstenedione might better correlated with metabolic phenotypes of PCOS. However, the association between androstenedione with metabolic features is controversial [19-21]. Due to unavailability of ultrasensitive assay, we could not measure these androgens in our study population.
In conclusion, this study demonstrates a significant association between IR and hyperandrogenemia where serum TT might independently predict IR. Our findings may help to elucidate a pathognomonic basis of PCOS and suggest future therapeutic targets based on androgen and IR status in these patients.
Acknowledgements: Department of Biochemistry and Microbiology, BSMMU for biochemical and hormonal assay
Conflict of interest: None of the authors has any conflict of interest to declare
Funding: Partial funding support by the Research and Development of BSMMU.
Data availability statement: The data that support the findings of this study are available from the corresponding author upon reasonable request.